Africa - The State of Mobile Advertising
Africa is a land of contrasts. It is the world’s second-largest continent (after Asia), and home to the second-largest population — yet it only outpaces Antarctica and Oceania for per capita GDP1 and has struggled with internet adoption. Africa places last among all continents, with just 26.5 %2 of Africans having access to the web. Despite Africa’s economic challenges, its many countries are rapidly expanding internet adoption via users with mobile devices.
In some countries, such as Kenya, where 99% of internet users gain access using a mobile device3 , mobile internet users are actually dominating the market. Analysis even shows that across the entire continent of Africa, 57.8% of all internet users gain their access via a mobile device.
Whether it is the resolve of the users or the power of mobile, or perhaps some combination of the two, one thing is certain — Africa is quickly expanding the use of mobile, and it is showing no signs of slowing down.
To provide a more complete view of the mobile internet and mobile-advertising landscape across Africa, this special study combines insights from two of Opera’s key global businesses:
Browsers for mobile phones
Mobile advertising
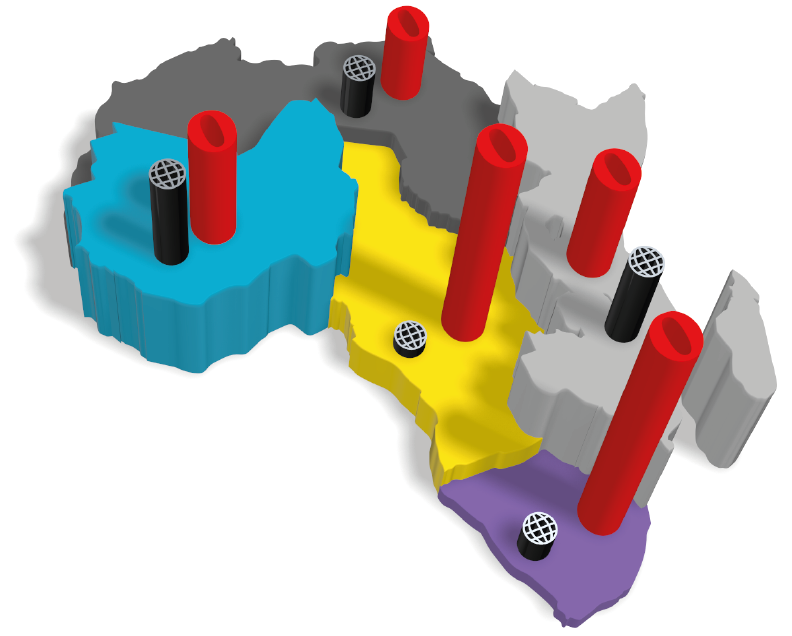
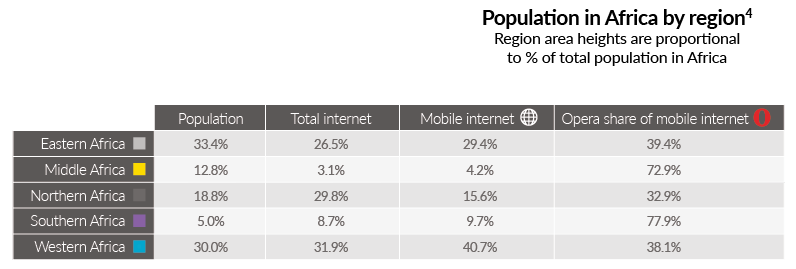
Opera Software’s total reach in Africa encompasses approximately 42.8% of all mobile internet users. However, as depicted above, this reach is not evenly distributed across the continent. In some regions we reach almost 78% of mobile users, while, in the Northern Region, our audience rests at approximately 33% of the mobile internet market.
1. World Bank, 2013
2. http://www.internetworldstats.com/stats.htm
3. Communications Commission of Kenya, Quarterly Sector Statistics Report, Second Quarter of the Financial Year, 2013/14
4. In accordance with UN designations at http://unstats.un.org/unsd/methods/m49/m49regin.htm#africa (see table on page 12)
Android is growing but feature phones still rule
Currently, Africans are more likely to use a feature phone (i.e., non-smartphone) than our global audience is, but that doesn’t mean they won’t make the shift someday. In fact, our data shows that smartphones, specifically Android devices, are a growing part of the mobile landscape in Africa.
Smart devices are gaining momentum. In Middle Africa, Android adoption rivals that of our global audience, while Northern and Southern Africa show significant adoption rates, as well. And, as the use of smartphones continues to accelerate, mobile internet use is bound to take off.
Internet traffic generated within Africa is well below the global average
Africa falls well below our global average for two key usage metrics — page views and data consumed per user per month — but, there is a silver lining.
When we look at the sub-markets in Africa, we find a promise for growth. In Middle, Northern and Southern Africa, all of which have significantly more smartphone penetration than average, we find a higher than average number of page views per user. And, when we look at Northern and Southern Africa, we find that users exceed the average for data consumption, with Northern Africa approaching global averages in both categories.
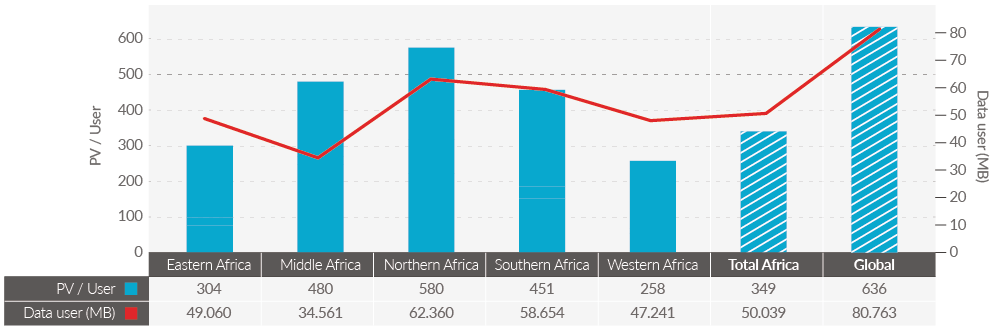
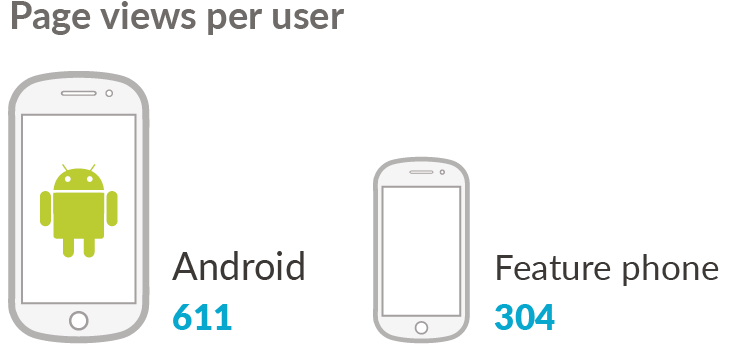
So, what is the cause of this growth? In one word — Android. Android has permeated these regions, and Android users interact with the mobile web at twice the rate of feature-phone users, as shown below.
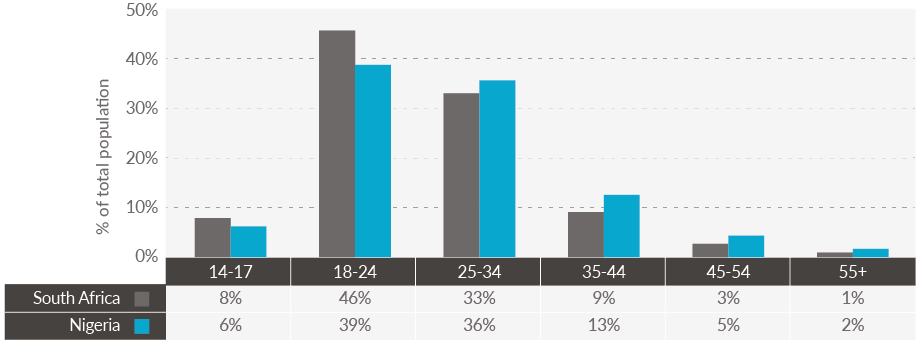
User demographics and site use
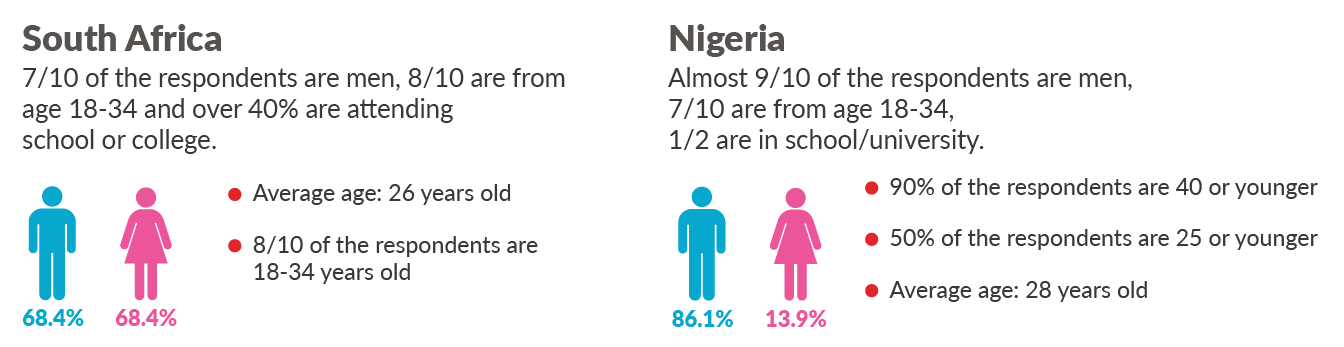
Now that we’ve laid out the mobile internet landscape in Africa and touched upon user behavior, let’s take a closer look at two key markets:
Nigeria: the largest single national market in the region, with the largest share of internet users in West Africa
South Africa: the country driving the most advertising revenue for Opera Mediaworks in the region
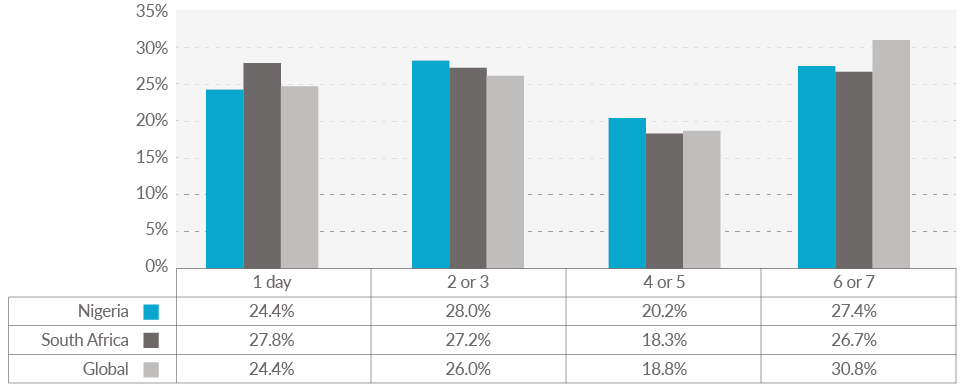
Frequency of use
Days of use
Mobile users in Nigeria and South Africa are very similar in terms of how often they access the mobile web each week. However, both countries fall below our experience globally for high-frequency (6 or 7 days per week) users.
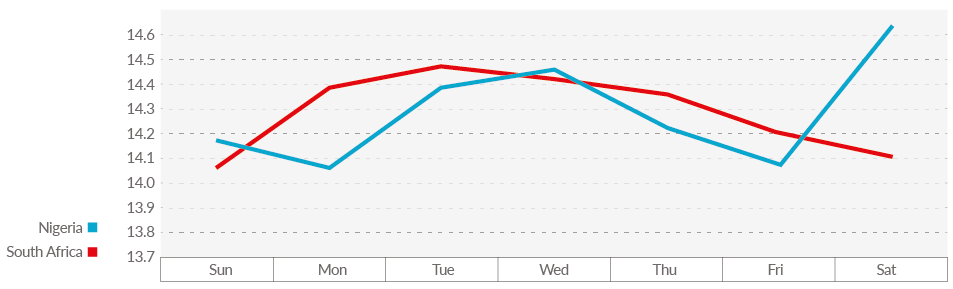
Day of week
Both countries show similar patterns throughout most of the week. Usage is lower on Monday, climbs higher at mid-week and then trails off until the weekend. On the weekend (Saturday and Sunday), South Africans are at their weekly low for volume. Nigeria, on the other hand, peaks on Saturday, drops on Sunday and then returns to the weekly low on Monday.
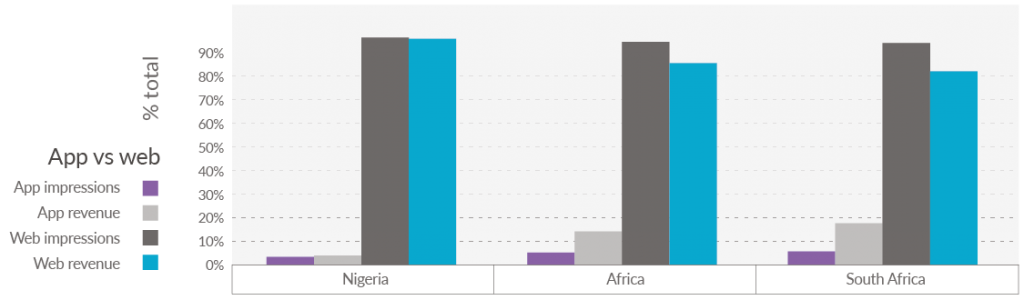
Website and mobile app use
Our research shows that app and web traffic varies significantly across the globe. In countries like the United States and Western Europe, where smart devices are prevalent, application traffic tends to be very high. In fact, app traffic is upwards of 60% in these markets. In regions like Africa, however, only about 5% of ad traffic comes from games and apps. However, the fact that app traffic tends to monetize better than web traffic still applies, which means big opportunities in African markets.
Audience categories
Mobile users in Nigeria and South Africa have different interests. To better understand these users, we place users in audience-segment categories based on whether the number of page views they generate to a specific category of website exceeds the market average for that site. For example, if 15% of a user’s page views are from Sports sites, and on average Sports sites account for 8% of all page views, then that user will be assigned to the Sports audience segment.
In the chart to the right, we compare the top 4 audience segments for each country, based the percentage of all users in the audience segment for that country. There are six axis points because each country has a different top 4, with some overlap. Nigeria included News, Sports, Social Networking and Business, while South Africa included Technology, Search, Social Networking and Business.
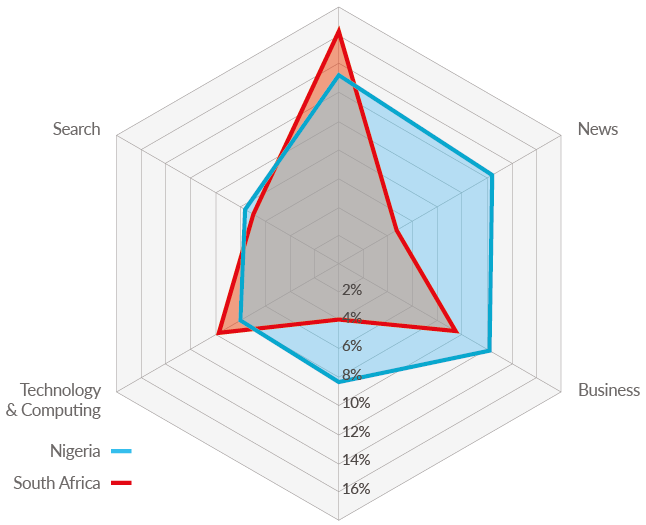
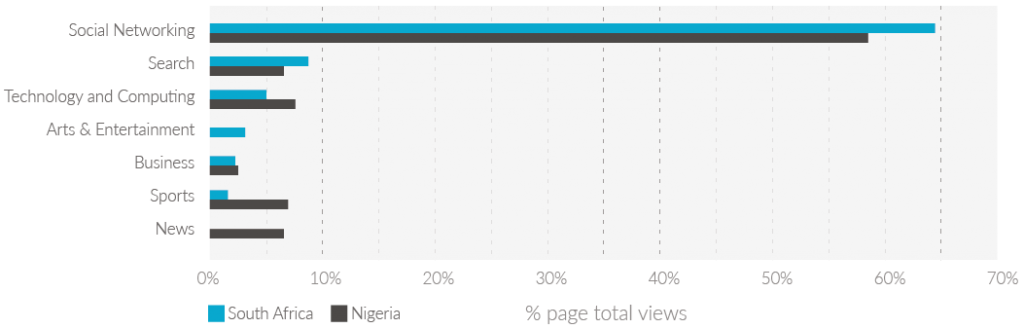
Social Networking is the largest audience in both countries. Mobile users from each country also show similar levels of interest in Technology and Computing. The most significant difference comes in terms of how Nigeria and South Africa users prioritize News, Sports and Search. It is important to note that this analysis compares relative interest in the category compared to the market average. The table below compares the top site categories in each country based on the percentage of total page views.
Audience segments
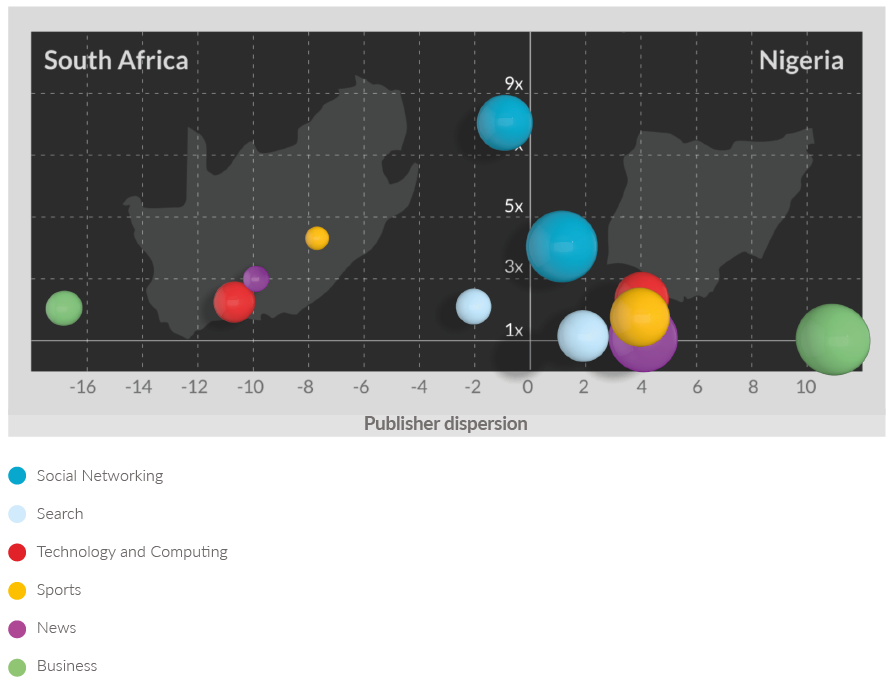
Now, let’s take a look at the potential for these six audience segments to deliver inventory to an advertiser. In the chart below, we compare the South African audiences on the left to the Nigerian audiences on the right.
The horizontal axis depicts publisher dispersion. Publisher dispersion is a metric used to understand just how competitive the marketplace is for websites in each category. For example, the Search audience will be much more interested in search sites over other websites. And, since Google is a clear market leader, with no major competition in the market, search is placed towards the intersection of the axes, i.e., it is highly concentrated vs being dispersed.
The vertical axis represents the average number of page views per user for the audience segment.
The size of the bubble represents the size of the audience in unique users.
This chart reveals:
1. The sizes of the audiences in Nigeria are larger than those in South Africa, which is a direct result of the population differences between the two countries.
2. In South Africa, the Social Networking audience consumes many more pages per user than any other audience does. This means there will be significantly more inventory on sites and apps catering to this segment than will be experienced in attempts to contextually target other audiences.
3. The publisher marketplace in Nigeria is far less competitive than that seen in South Africa. For advertisers in Nigeria, this means that they will need to compete for inventory with other advertisers at relatively few media outlets. In South Africa, on the other hand, four of the six audiences are focused on many different sites. Only Business audience members in Nigeria disperse their browsing to such a degree.
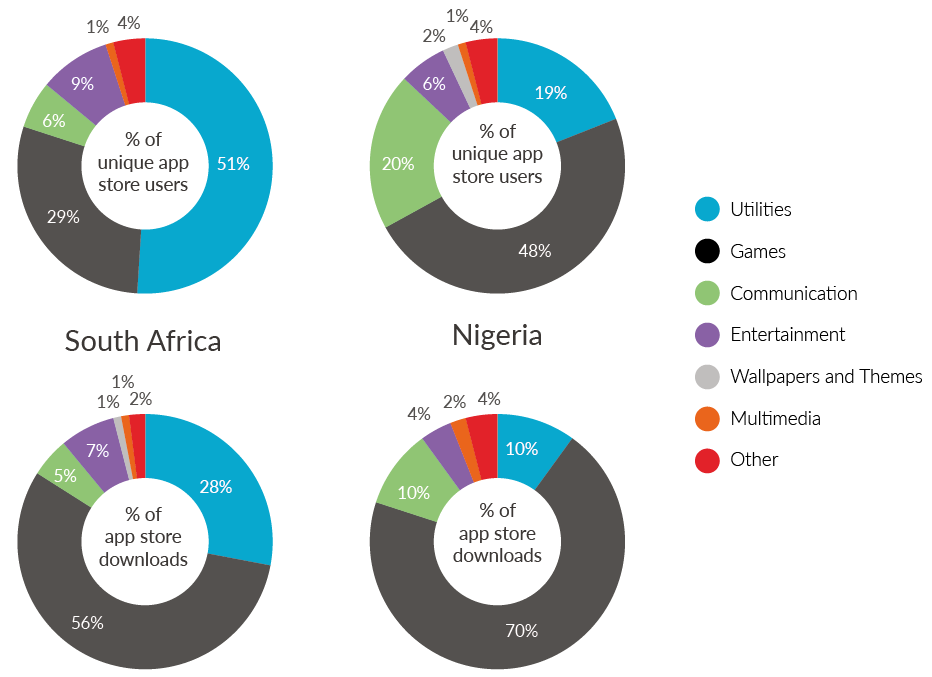
Top mobile apps
The Opera Mobile Store is one of the three largest mobile app stores in the world, delivering premium paid, free and freemium apps for both Java and Android devices. Below, we break down Opera Mobile Store traffic by app category for downloads and unique visitors. Though neither the South African nor the Nigerian market shows a high level of usage of apps, we believe this market will grow substantially, as more users adopt smart devices.
Top advertisers
Opera Mediaworks supports over
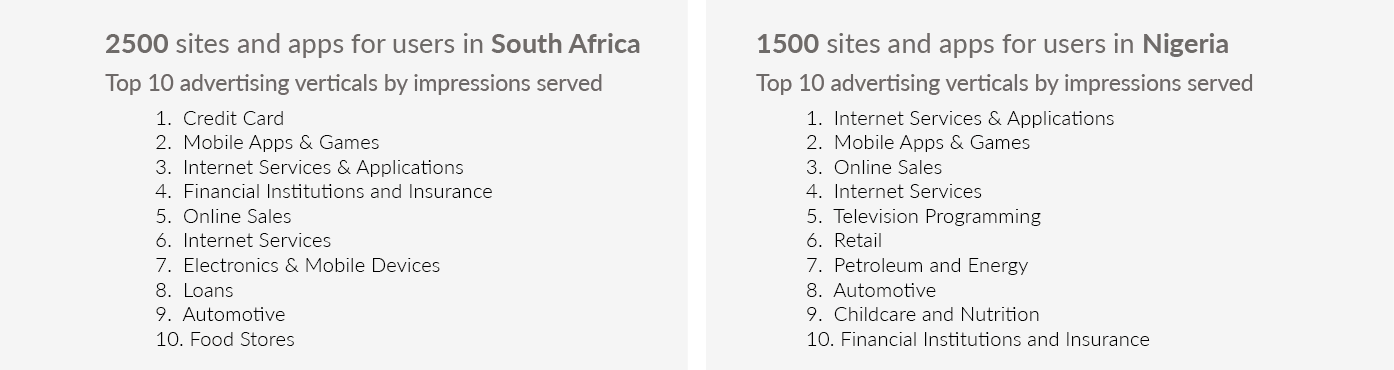
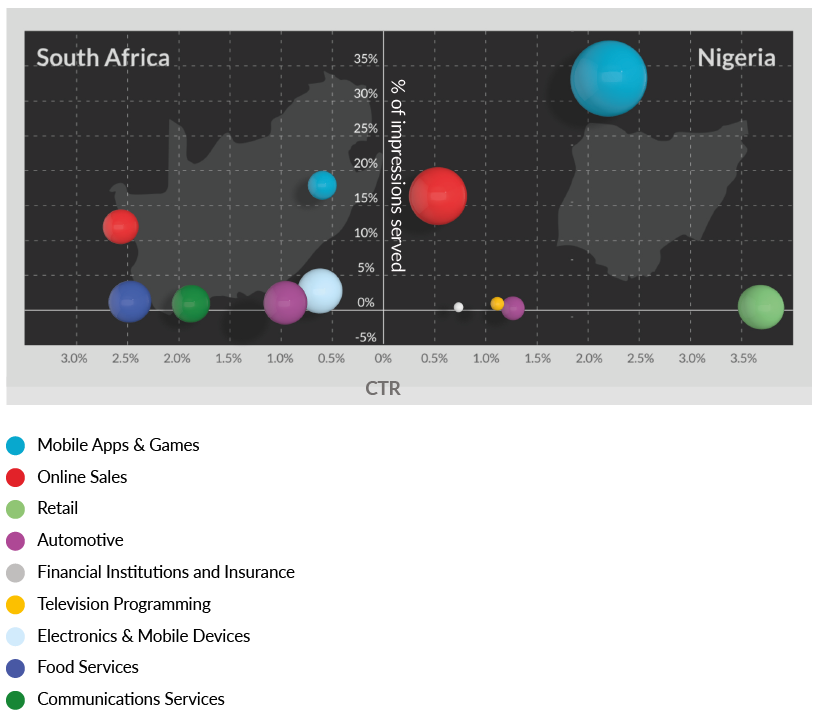
Impressions aren’t everything. Though the advertising verticals shown in the lists above performed well in terms of impressions delivered, that did not always mean that the customers clicked on the ads (as measured by click-through rate, or CTR) or result in revenue for the publishers.
To get a better look at advertisement performance, we created a list of the advertising verticals that performed in the top 10 of all verticals for each of the measures of impressions served, CTR and revenue production. In other words, the advertising vertical must perform in the top 10 in every measure to make the list for analysis. In neither country did the top advertising vertical for impressions served make the list.
South Africa has a relatively even distribution of revenue generation and impression volumes are more evenly shared than in Nigeria.
Nigeria is dominated by campaigns for Apps and Games, with this vertical achieving over 50% of all revenue and an impressive CTR. Other categories achieve much lower revenue generation and very modest CTR.
Market innovations
Web passes
The digital revolution in Africa is undoubtedly tied to the success of mobile. Given Africa’s relatively low level of total internet adoption (26.5%) and the fact that more than half (58%) of those users access the internet via their mobile devices, successfully increasing internet adoption relies on mobile’s success.
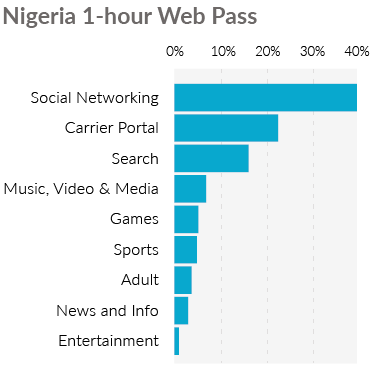
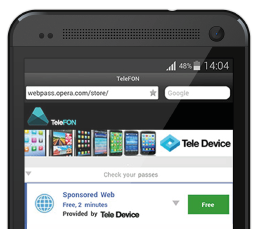
One of the more innovative ways of increasing mobile internet adoption has been the introduction of short term passes for internet access. These passes can be sponsored by brands or mobile operators and grant short-term access to the internet. So, users who do not want to make a full commitment can hop on the internet for as short a time as one day or even one hour. The majority of the time, these passes focus on giving users access to carrier portals, but other site categories have also been very successful at attracting users.
As shown on the table below, most users spend their precious access time visiting Social Networking sites, followed by Carrier Portals. However, a substantial number of users also go to Music, Video & Media sites, typically to download MP3s. Gaming sites also see significant traffic from users with a limited time to browse. Web passes mean a big opportunity for music and game providers to attract users, or for brands to offer valuable incentives to engage customers.
Opera Web Pass allows mobile operators to move beyond confusing, megabyte-based data plans and package their mobile internet offerings in flexible, easy-to-understand and marketable ways. Plans can be offered for limited periods or constrained to a pre-determined list of websites. Mobile operators easily team up
with brands in their local markets to sponsor the full cost of customers’ mobile internet access and provide users with free mobile data. These innovations are a huge leap forward in helping operators bring new internet users online.
Access to health information
In a recent study on the Health & Fitness category, we looked at whether doctor availability influenced user interest in healthcare sites and apps. For this investigation, we examined each country’s percentage of traffic from Health & Fitness sites and apps, then compared that to the country’s share of total impressions. We then grouped all of the countries into three equal segments based on estimates of their number of doctors per capita5. The table to the right details our findings.
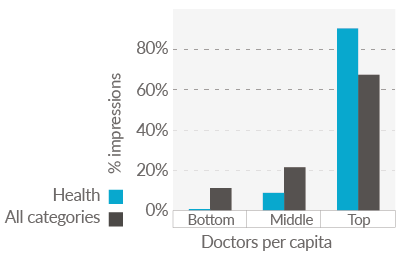
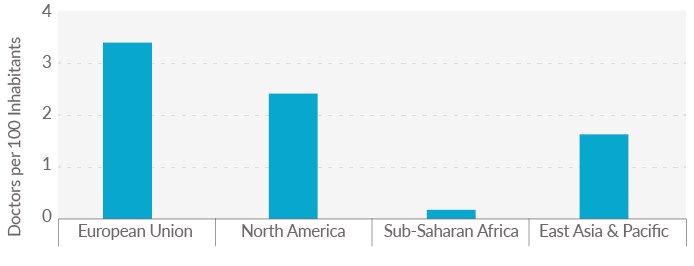
Countries with the most doctors per capita account for 67% of our total impressions across all categories and consume over 90% of impressions to health sites. On the flipside, countries with the fewest doctors per capita make up 11% of our total impressions and consume less than 1% of our health-focused site impressions. These findings highlight the global healthcare “gap” depicted in the graphic below, and reveal an extremely large untapped audience for healthcare-related sites and apps. While monetizing these sites and apps may be difficult in these markets, there is no denying that the opportunity for governmental action, philanthropy by individuals, mobile operators, brands and NGOs is tremendous.
Innovation leads to solutions and growth
During a humanitarian crisis, quick access to information is crucial. Given that the mobile phone is the primary mode of internet access for most Africans, Airtel in Nigeria and Sierra Leone, in collaboration with Opera Software, has launched a free service for Airtel’s customers who are seeking information about the Ebola virus. Subscribers simply need either to click the “Ebola Info” Speed Dial entry in the mobile browser or in the Airtel mobile store, or they can choose the free “Ebola Info”option in the Opera Web Pass storefront. Users are then directed to sites they can browse to educate themselves on the virus, such as Ebolafacts.com, Sierra Leone’s Ministry of Health website and the World Health Organization website — all for free.
5. The source for our estimate of doctors per capita came from the World Bank. See (http://data.worldbank.org/indicator/SH.MED.PHYS.ZS).
UN Subregions of Africa
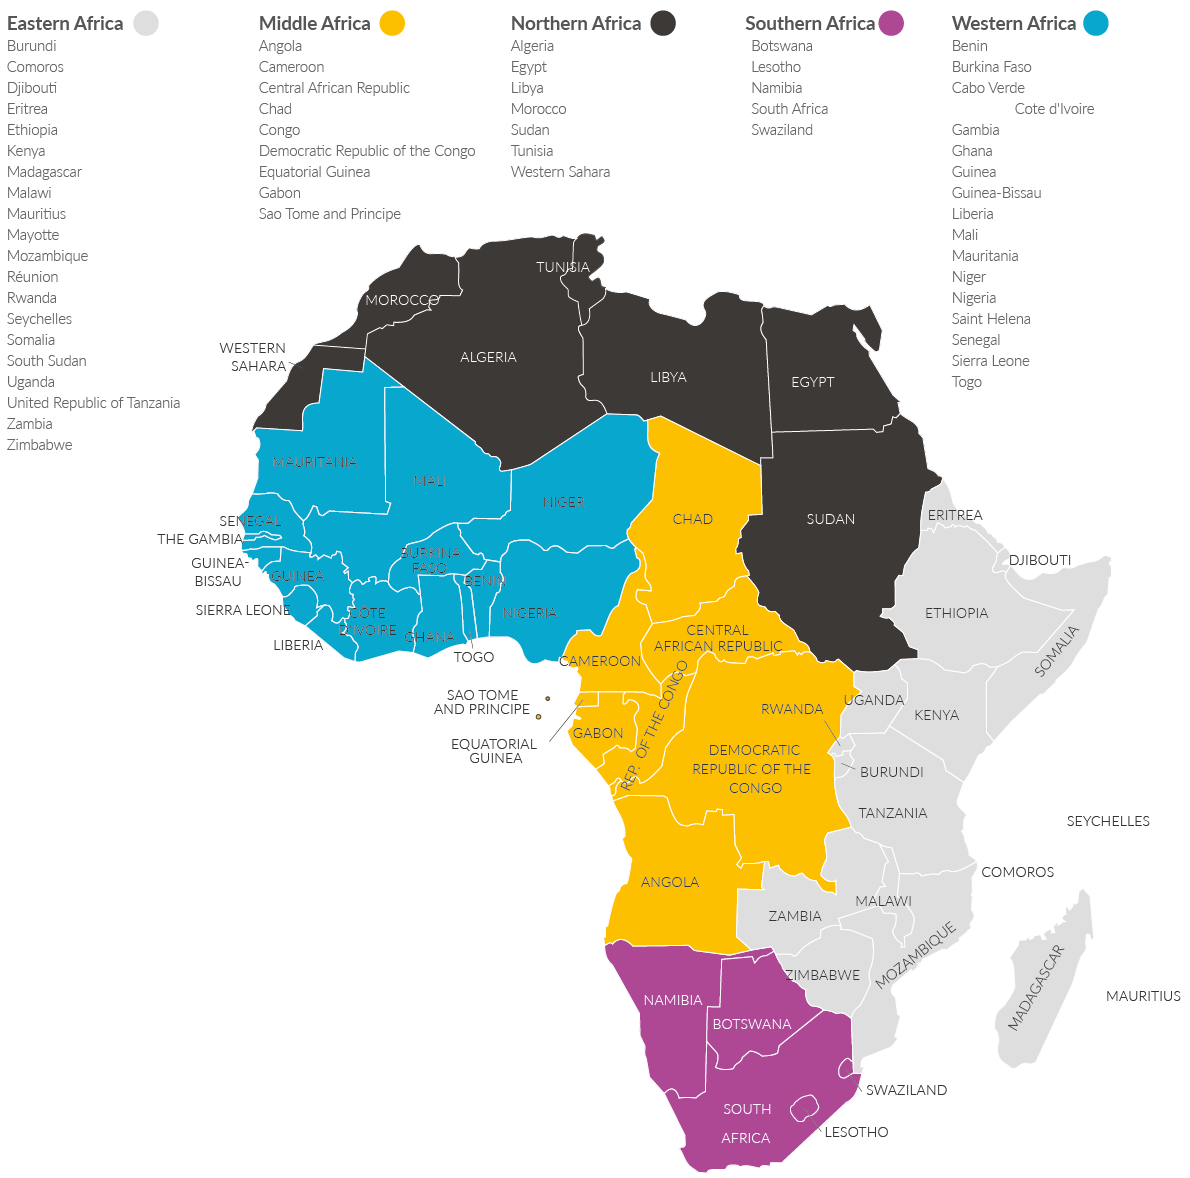
In accordance with UN designations at http://unstats.un.org/unsd/methods/m49/m49regin.htm#africa