 Every year, creative communications industry professionals gather in Cannes, France for the advertising industry’s biggest awards show and festival: Cannes Lions. This year a special focus of the event is Lions Health, which is billed as the world’s first festival of creativity in healthcare communications. In honor of this event, Opera Mediaworks conducted a focused study of mobile advertising and consumer use of mobile Health & Fitness sites and applications. This study leverages insights from the over 500 million impressions per month we manage for over 400+ sites and applications focused on Health & Fitness content. It also leverages findings from our own consumer survey completed in May 2014.
Where are Health & Fitness sites and applications the most popular?
Each month the Health & Fitness category accounts for approximately 5% of our global revenue and impressions under management. In this analysis, we wanted to identify which countries stand out as having an audience that is significantly more or less engaged with Health and Fitness content. To do this, we compared the percentage of traffic from Health & Fitness sites and apps from each country with that country’s share of total impressions. This allows us to estimate whether the country’s audience is more or less inclined to use Health & Fitness sites and apps. The results for our top 10 countries, as measured by total monthly impressions, are shown below. The United States audience generated the most ad impressions for the category but, as the graph shows, Canadians are the most engaged with Health & Fitness sites and apps, while our audience in Russia is the least engaged.
 Is the audience for Health the same as the Fitness audience?
This led us to question whether, internal to Health & Fitness, there is a difference between the audience using “Health” and those using “Fitness” sites and apps. We define “Health” sites and applications as the sub-category focusing on medical and healthy lifestyle issues. “Fitness” sites are those catering to exercise interests or weight control.
We found that in the majority of cases audience interest in Health and Fitness is closely linked. Countries showing above-average interest in health or fitness also show an average or above-average interest in the other sub-category. However, there are a few cases where we saw a sharp divergence.
Those few cases where we saw the two sub-categories moving in opposite directions from the country average led us to investigate whether the availability or lack of advanced medical care results in more or less interest in health sites.
For this investigation, we again compared the percentage of traffic from Health & Fitness sites and apps for each country with that country’s share of total impressions and then grouped all of the countries into three segments based on estimates of their number of doctors per capita.1 The table below details our findings.

While countries with the most doctors per capita account for 67% of our total impressions across all categories, they consume over 90% of impressions to health sites. In contrast, 11% of our total impressions are destined for countries with the fewest doctors per capita, and that audience consumes less than 1% of our health-oriented impressions. While this highlights the global healthcare gap, it also reveals an extremely large, untapped audience for healthcare-related sites and apps.
1. The source for our estimate of doctors per capita came from the World Bank. See (http://data.worldbank.org/indicator/SH.MED.PHYS.ZS).
How do the Health and Fitness audiences differ?
The Health & Fitness audience is far more likely to use an iPhone than other devices and far less likely to use a tablet than a phone. Among Android users, the Fitness audience was significantly larger than the Health audience.

ENGAGEMENT BY TIME OF DAY AND DAY OF WEEK
The Health & Fitness audience is significantly more active midweek (Tue-Wed) and least active on the weekend (Fri- Sun).
The Health & Fitness audience segments into two distinct sub-groups when viewing usage by time of day. Fitness sites and applications have the most usage during the afternoon and evening, with peak usage and engagement occurring between 9 and 10 PM. Health sites have the most usage during the early afternoon, with traffic peaking around 12 noon to 1PM.

INTERACTION WITH AD CAMPAIGNS
Successful campaigns in the Health sub-category come from very different advertiser and brand verticals than those in the Fitness sub-category. Only one ad vertical, Food & Drink, is a top vertical for both audiences.

How are users interacting with their mobile devices to meet their Health & Fitness needs?
For the final part of our report, we focus on the United States, as it provides the greatest quantity of traffic to our platform from Health & Fitness sites and applications. To find out how mobile users in the U.S. use their mobile device to meet their Health & Fitness needs, we conducted two research projects.
• We analyzed traffic from over 49,000 unique smartphones interacting with Health and Fitness sites.
• Using our Survey Manager service, we conducted a mobile online survey of over 2,000 U.S. smartphone consumers.

How often do people use Health & Fitness sites and apps?
Our survey revealed that over 50% of smartphone users use their device to learn about diet, exercise or other health and wellness topics. However, less than a quarter of them (22.45%) can be considered regular users (greater than 1x per week).

What activities do Health & Fitness users focus on?
Of the survey respondents using Health and Fitness sites and applications, over 68% engage with diet or exercise sites.

What categories of media publishers do Health & Fitness users favor?
Health and Fitness audience profiles are very different. As shown in the graphic below, when Fitness users are not engaged on a Fitness site or app, they focus their attention on the Entertainment and Productivity categories. The Health audience is most likely to place their attention on Social Media activities and News sites.

How does the Health-focused audience use their device?
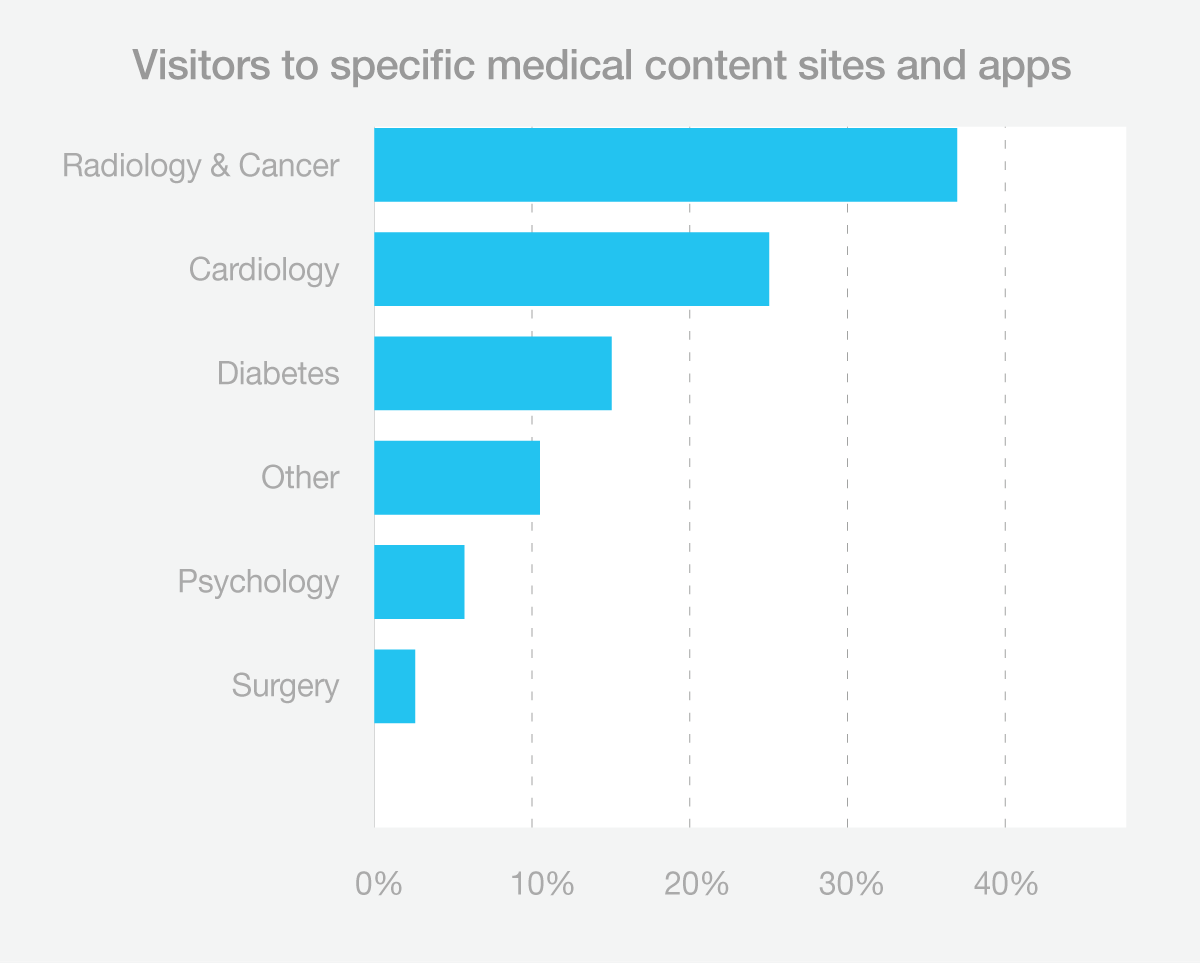
Within the Health sub-category over 90% of users visit sites where the publisher addresses a broad range of health-related information. There is also significant traffic to sites with specific medical content. The table below details the subject matter of the content-specific sites with the most traffic.
How does the Fitness audience use their device?
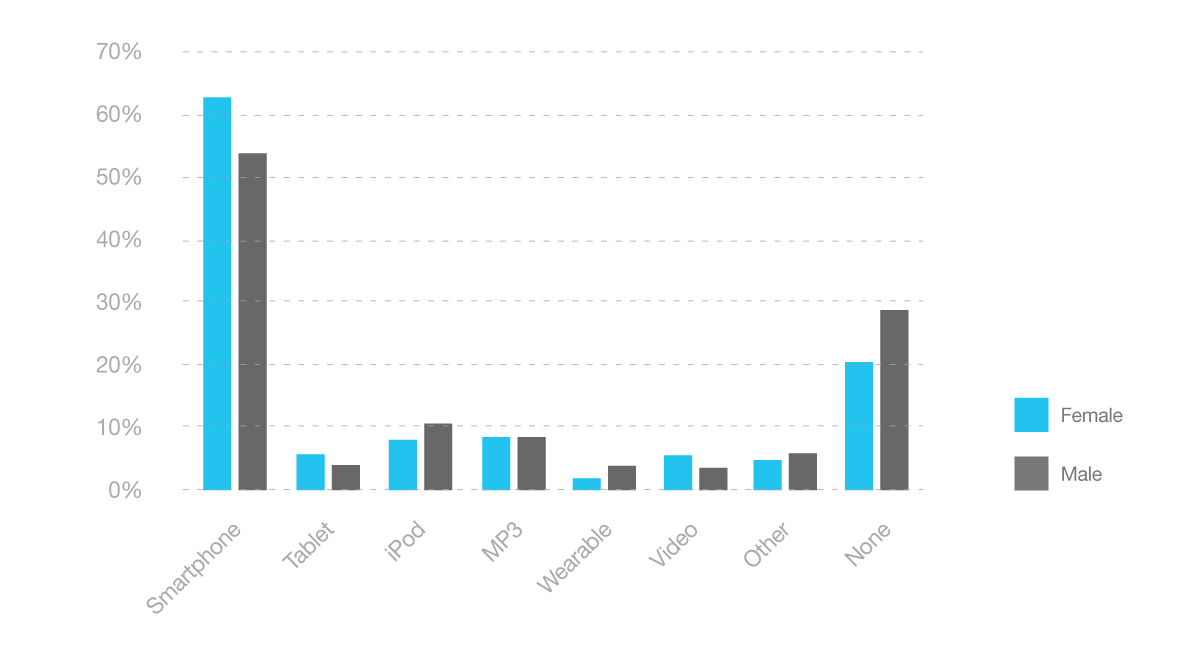
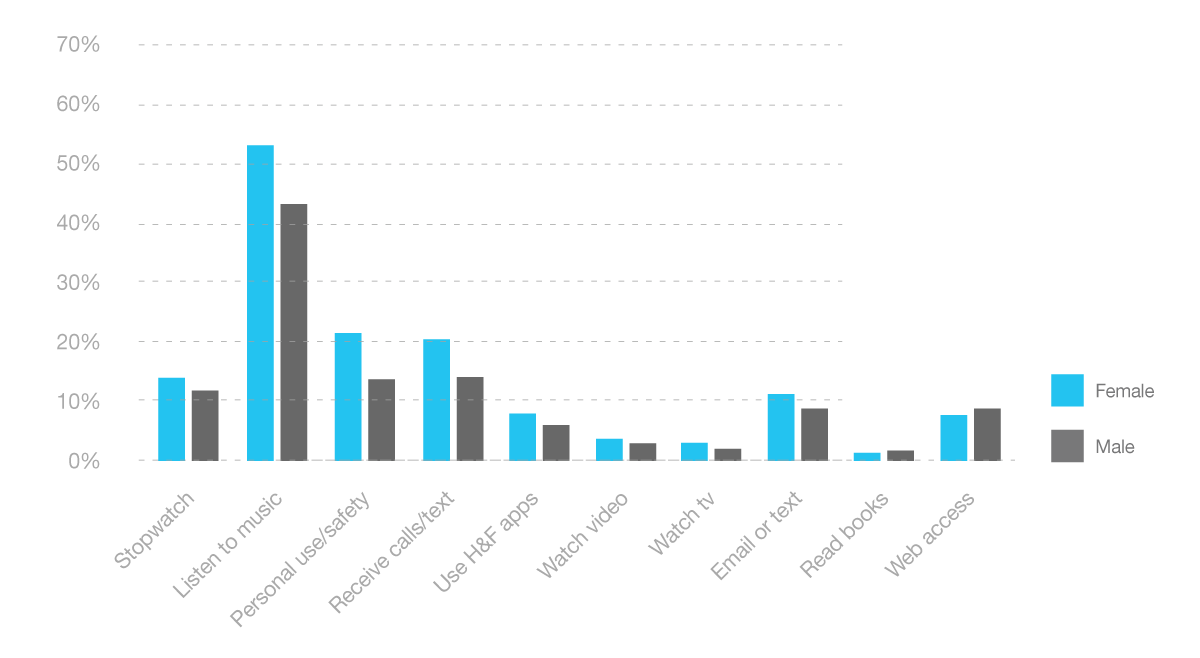
To investigate the Fitness audience in more detail, we focused our efforts on our consumer survey. We designed the survey to address questions as to how the Fitness audience uses a mobile device while exercising. We found:
Age and gender differences
Significantly more females than males carry a mobile device while exercising. Although overall the use of wearables (e.g., fitness trackers such as Jawbone UP, Fitbit, FuelBand etc.) is minimal, significantly more males than females carry a wearable device (3.61% of males, 1.71% of females)

Women have a far greater preference for maintaining communications, either to send or receive texts and calls, or for safety, than do men. Women also report more interest in listening to music while exercising than do men.

There were few pronounced age differences in the survey results. For the most part, the reported use of devices or services closely paralleled the sample’s age and gender breakdown by percentage. This trend is exemplified by the graphic below, which compares overall share of responses by age and gender with the use of mobile devices to listen to music while exercising. As shown, service distribution is nearly equitable to overall share of the respondents with the exception of a slight decline in usage for the two older age demographics.

Two areas where we observed a strong divergence in reported usage rates when compared to the survey sample’s overall makeup was for the use of Health & Fitness applications and engagement with TV and movie content.
Males in the 25-34 age group showed a much stronger preference for using Health & Fitness applications on their mobile devices than any other age and gender group.

We noted previously that females tend to use mobile devices as part of their fitness programs more than men, and this is the case in the area of watching TV and movies. However, this observation is strongly influenced by the behavior of the 25-34 year old group, where women show a strong preference for watching TV while men in that age group show little interest. This significant lack of interest by men 25-34 overcomes a fairly strong interest observed in the male age 18-24 group.

For more details from our survey or to learn more about Survey Manager, see us at Cannes Lions, contact your Opera Mediaworks account manager or get in touch via [email protected].